📈
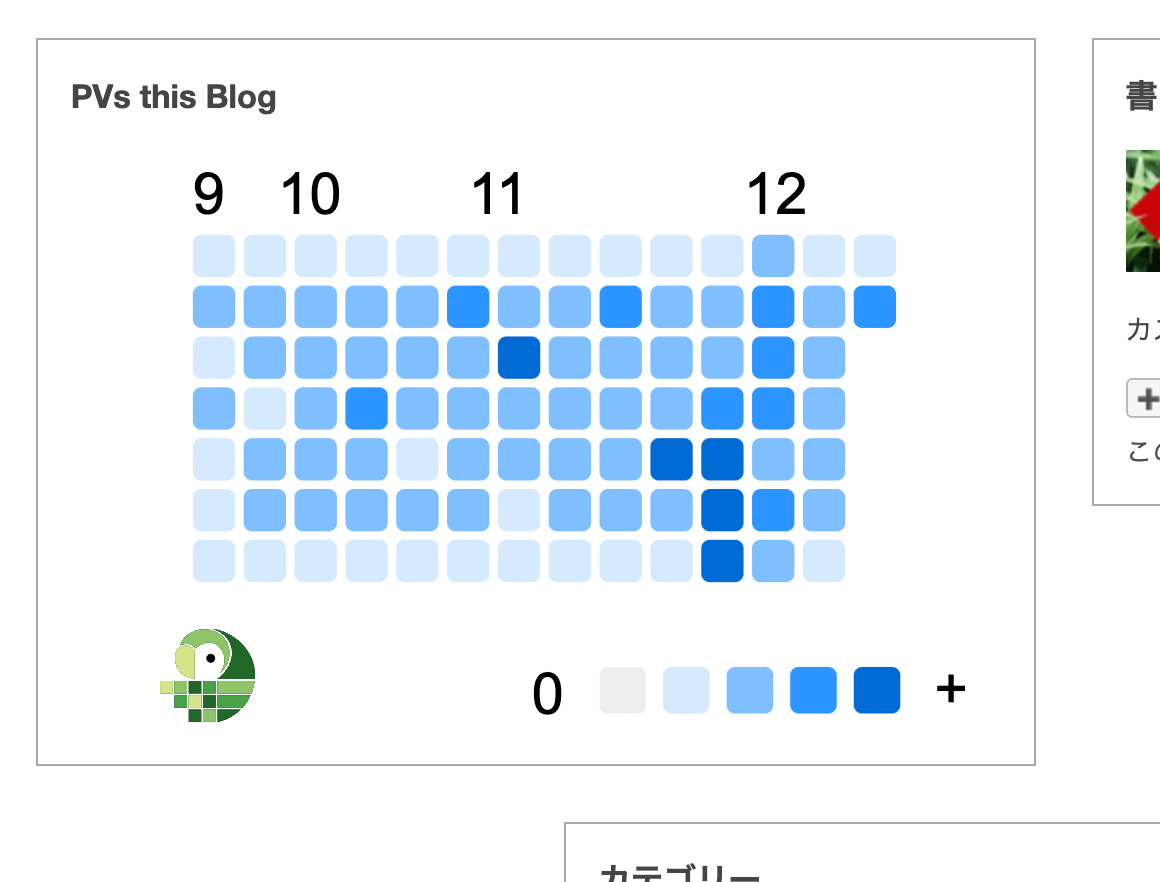
Measuring and visualizing page views on your website with Pixela
One of the properties that can be specified when creating a new graph definition or updating an existing graph definition is . The following is an example of an API request to update the of an existing graph to .
A graph with its as will, when its image is displayed example, when of the graph is called — , it will display the image of the graph and at the same time add the value of the day by the minimum unit.
The minimum unit is as follows:
- If of the graph is :
- If of the graph is :
In other words, the number of times the graph have been displayed can be directly showed on that graph. Therefore, it’s a perfect way to measure and display the number of page views of your website.

If you prepare the graph that its is , then the thing you have to do is embedding the graph in the website where you want to measure page views
Once you have a graph with is , all you need to do is embed it in your website where you want to measure page views (the number of times the graph is displayed). Please see Embedding a graph in your website in the easiest way about how to embed graphs in your website.
Notes
- This feature does not provide exact measurements.
- You can also specify for . It will subtract the value of the day by the minimum unit. The minimum unit is as follows:
- If of the graph is :
- If of the graph is :
- This feature is only available to Pixela supporters as of December 2021.
- Please see Make exclusive features available as a benefit of supporting Pixela - Pixela Supporter Program how to support Pixela.
Related